Track Play Count Analysis
Track Play Count Analysis tells you how many times each track played during a date and time range. It works through the playout logs for the period you choose and counts every play for each track, so you can see at a glance which tracks are getting heavy rotation and which are barely heard.
This is useful when you want to check the balance of your output. For example, you might run the analysis over the past month, sort by play count, and find that a handful of tracks have played 40 or 50 times while dozens of others have not played at all. That tells you to either rest the over-played tracks or bring the never-played ones into rotation. The analysis is also handy for producing an airplay chart show, where you need an ordered list of the most-played tracks for a given week.
To open the page, go to Tools and select the Track Play Count Analysis tab. This tab is only available to users whose role includes permission to manage logged tracks.
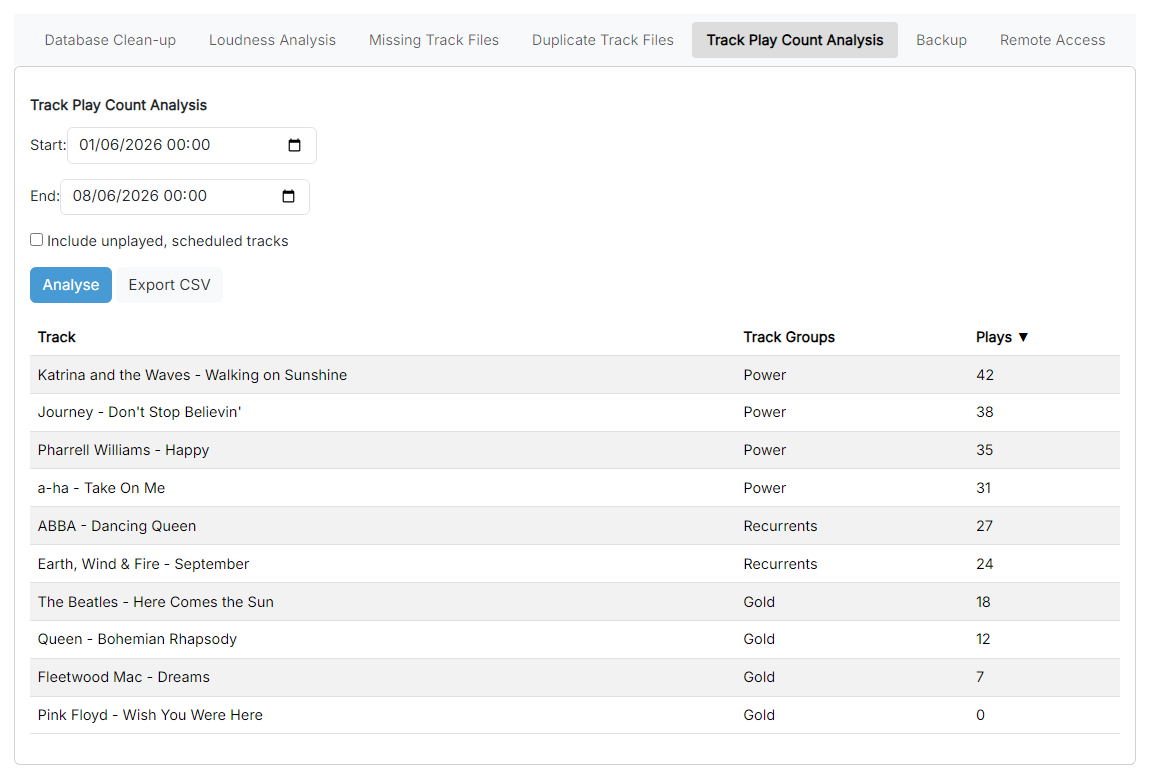
Track Play Count Analysis ranks tracks by the number of plays in the selected date range.
Date range

The Start and End date/time inputs that define the period to analyze. Every play recorded in the playout logs between these two points is counted. Here they are set to a one-week window, with a Start of 01/06/2026 00:00 and an End of 08/06/2026 00:00. By default the page opens with End set to the current date/time and Start set to 24 hours earlier; change them to cover whatever period you need, such as a full week for a chart show or a month for a rotation review.
Include unplayed tracks

The Include unplayed, scheduled tracks checkbox, shown unticked. Tick it to also include tracks that were scheduled but did not actually play, for example because they were dropped by a Fixed Time Marker. This option also brings in tracks scheduled in a future date range. Leave it unticked if you only want to count tracks that genuinely went to air.
Analyze button

The Analyze button that runs the analysis, shown in its normal (not spinning) state because the analysis has already completed. When you click it, PlayIt Manager works through the playout log for the selected range and counts the plays for each track. Once it finishes, the results table appears below.
Export CSV button
The Export CSV button, shown next to Analyze because results have been returned. Click it to download the results as a CSV file. The CSV contains the same Track, Track Groups and Plays columns and can be opened in Microsoft Excel or Google Sheets for further analysis.
Results table
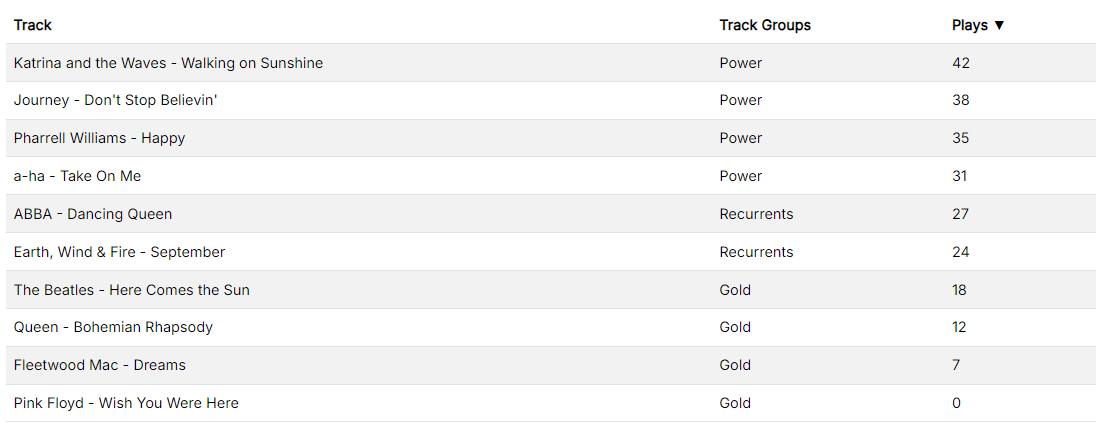
The results table, sorted by Plays with the most-played track at the top. Each row shows the Track (its artist and title), the Track Groups it belongs to and its number of Plays during the range. Click any column header to sort by that column; click the same header again to reverse the sort direction.